Code Coverage Guide
This guide explains how to use code coverage tools with the Tracker REST API.
Overview
Code coverage is a measure of how much of your code is executed during your tests. It helps you identify areas of your code that are not being tested, which can help you improve your test suite.
The Tracker REST API uses pytest-cov for code coverage, which is a pytest plugin that integrates with the coverage.py tool.
Running Tests with Coverage
You can run tests with coverage reporting in several ways:
Using the Command Line
To run tests with coverage reporting from the command line:
# Run a specific test file with coverage
python -m pytest tests/api/routes/test_brands.py --cov=app --cov-report=xml --cov-report=html -v

# Run all tests with coverage
python -m pytest tests --cov=app --cov-report=xml --cov-report=html -v
This will generate:
- A terminal report showing the coverage percentage for each file
- An XML report in
coverage.xmlthat can be used by tools like SonarQube or the Coverage Gutters VSCode extension - An HTML report in the
htmlcovdirectory that you can view in a web browser
Using VSCode Tasks
We've added tasks to VSCode that make it easy to run tests with coverage:
- Press
Ctrl+Shift+P(orCmd+Shift+Pon macOS) to open the command palette - Type "Tasks: Run Task" and select it
- Choose one of the following tasks:
- "Run pytest with coverage" - Runs the current test file with coverage
- "Run all pytest with coverage" - Runs all tests with coverage
Using VSCode Launch Configurations
We've also added launch configurations to VSCode that let you debug tests with coverage:
- Open the test file you want to run
- Click on the "Run and Debug" icon in the sidebar
- Select one of the following configurations from the dropdown:
- "Python: Debug Tests with Coverage" - Runs the current test file with coverage
- "Python: Debug All Tests with Coverage" - Runs all tests with coverage
- Click the green play button
Viewing Coverage Reports
HTML Report
The HTML report is the most user-friendly way to view coverage data. To view it:
- Run tests with coverage as described above
- Start a web server to serve the HTML report:
python -m http.server 8080 --directory htmlcov - Open a web browser and navigate to http://localhost:8080
The HTML report shows:
- A list of all files with their coverage percentage
- For each file, a line-by-line view showing which lines were executed (green) and which were not (red)
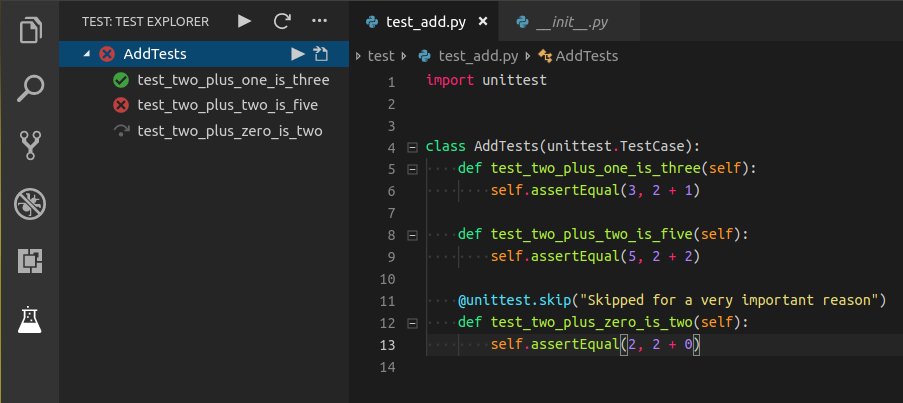
VSCode Test Explorer with Coverage
We've configured VSCode to show test coverage information directly in the Test Explorer view. This gives you a nice visual representation of your test coverage, similar to the screenshot below:
To set this up:
- Install the required VSCode extensions:
- Test Explorer UI
-
Reload VSCode after installing the extensions
-
Open the Test Explorer view by clicking on the flask icon in the sidebar
-
Run your tests by clicking the play button at the top of the Test Explorer
After running the tests, you'll see a new "TEST COVERAGE" section in the Test Explorer view that shows the coverage percentage for each file. You can expand each file to see the coverage for individual functions.
VSCode Coverage Gutters (Alternative)
If you prefer to see coverage information directly in the editor (as colored gutters), you can use the Coverage Gutters extension:
- Install the Coverage Gutters extension from the VSCode marketplace
- Run tests with coverage as described above to generate a
coverage.xmlfile - Open the command palette (
Ctrl+Shift+PorCmd+Shift+P) and select "Coverage Gutters: Watch"
This will show:
- Green highlights for lines that were executed
- Red highlights for lines that were not executed
- Yellow highlights for lines that were partially executed (e.g., only one branch of an if statement was executed)
Improving Coverage
To improve coverage:
- Identify files with low coverage
- Look for red lines in the coverage report
- Write tests that execute those lines
- Run the tests with coverage again to verify that coverage has improved
Focus on testing:
- Edge cases
- Error handling
- Different branches of conditional statements
- Different paths through the code
Continuous Integration
The CI/CD pipeline can be configured to run tests with coverage and fail if coverage drops below a certain threshold. This helps ensure that code coverage doesn't decrease over time.