AWS ECS Production SOP
This runbook explains how to check the production tracker system after it was moved to AWS ECS.
Use it when you need to confirm that the production environment is healthy, identify the service responsible for a problem, or find the logs for deeper investigation.
Accessing AWS
- Open the AWS SSO start page:
https://fireboltgroup.awsapps.com/start/# - Sign in to the
Glimpse Analytic LtdAWS account. - Use the
AdministratorAccessrole to open the AWS console.
Where To Look
In the AWS console:
- Search for
ECSor openElastic Container Service. - Go to
Clusters. - Open
tracker-restapi-production-cluster.
Open A Shell In The VPC
Because none of the ECS containers are running with ECS Exec permissions, this helper script is
the only supported way to obtain a shell inside the tracker production VPC. It starts a temporary
task based on the api container, mounts the repository scripts/ directory, and then opens a
shell in that environment.
Use it when you need to inspect network access, environment state, or run debugging commands from within the production path:
AWS_PROFILE=glimpse-prod ./scripts/open_tracker_ecs_shell.sh
This is the safest way to investigate issues that only appear from inside the production VPC,
and it lets you run any of the available scripts from the mounted scripts/ directory, such as
log inspection or other operational checks.
What Healthy Looks Like
In normal operation, the cluster should show 8 services.
Each service should have:
Statusset toActiveDeploymentsshowing only green barsTasksshowing only green bars1/1tasks running
Blue bars usually indicate an in-progress deployment or another non-steady state. In routine production operation, you should not expect to see blue bars.
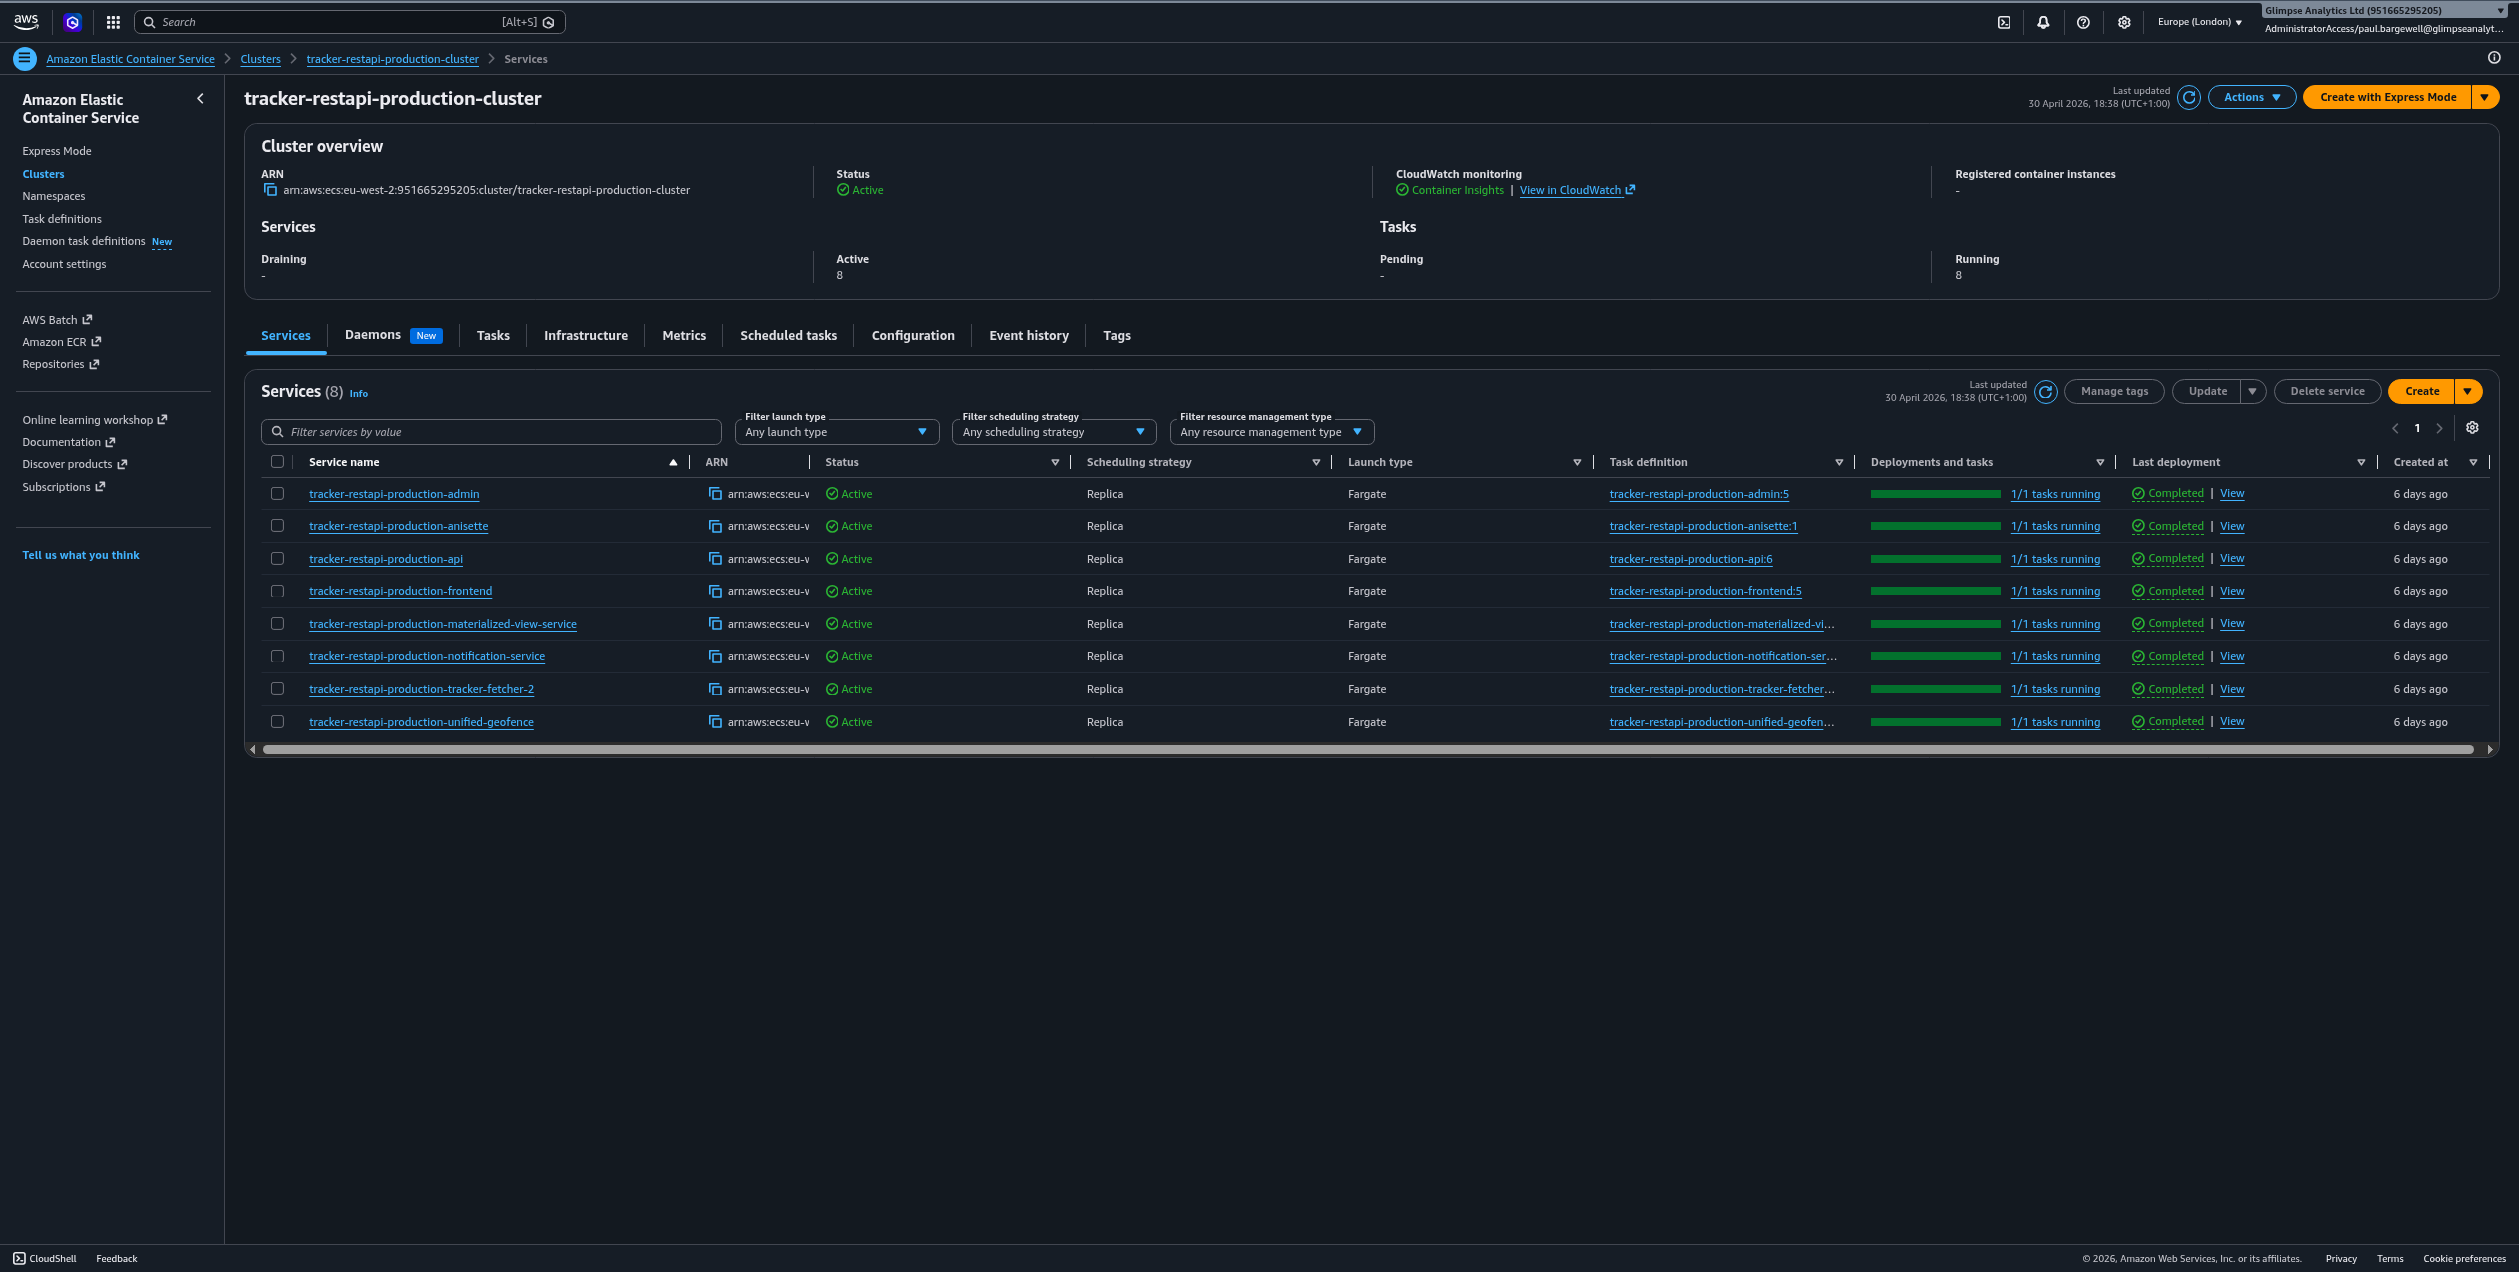
Expected Services
The production cluster should contain these services:
| Service name | Purpose |
|---|---|
tracker-restapi-production-admin |
Admin UI backend |
tracker-restapi-production-anisette |
Anisette bootstrap and Apple account support |
tracker-restapi-production-api |
Main tracker REST API |
tracker-restapi-production-frontend |
Public frontend |
tracker-restapi-production-materialized-view-service |
Materialized view maintenance |
tracker-restapi-production-notification-service |
Notification delivery |
tracker-restapi-production-tracker-fetcher-2 |
Apple Find My tracker fetcher |
tracker-restapi-production-unified-geofence |
Unified geofence processing |
If the service count differs from 8, check whether a deployment is in progress, whether a service was intentionally removed, or whether ECS is failing to place tasks.
How To Check Logs
To inspect a service:
- Click the service name.
- Open the
Logstab. - Review the recent log stream entries.
Look for:
- repeated task crashes
- authentication failures
- database connection errors
- Redis or queue issues
- deployment start-up errors
- tracebacks that appear after a new rollout
If the service has a health check problem, the logs usually explain why the task is not staying in service.
How To Restart A Service
If a service is wedged, unhealthy, or needs to pick up a configuration change, restart it by forcing a new ECS deployment. This is the standard way to restart the running containers because the tasks do not have ECS Exec enabled and there is no direct shell access into the running tasks.
In the AWS console:
- Open the affected service.
- Choose
Update service. - Enable
Force new deployment. - Save the change.
ECS will stop the existing task and start a replacement task from the same service definition.
For a healthy service, the deployment should settle back to 1/1 running tasks with green bars.
If you only need to bounce a single stuck task, you can stop the task from the service page and let ECS replace it automatically.
CLI equivalent:
AWS_PROFILE=glimpse-prod aws ecs update-service \
  --cluster tracker-restapi-production-cluster \
  --service tracker-restapi-production-api \
  --force-new-deployment
Replace tracker-restapi-production-api with the service you want to restart. This performs the
same action as Force new deployment in the console and is useful when you are already working
from a shell inside the VPC or prefer to automate the restart.
What To Check First
If something looks wrong, check the following in order:
- The service
Status - The task count, especially whether it is still
1/1 - The
DeploymentsandTasksbars for blue sections - The most recent log lines for the affected service
- Whether the issue affects one service or multiple services at the same time
That sequence usually tells you whether the problem is isolated to one component or is affecting the whole cluster.
Quick Triage Guide
- API or frontend problems: check
tracker-restapi-production-apiandtracker-restapi-production-frontend - Authentication or Apple account problems: check
tracker-restapi-production-anisette - Tracker fetch failures: check
tracker-restapi-production-tracker-fetcher-2 - Geofence processing problems: check
tracker-restapi-production-unified-geofence - Missing or stale materialized data: check
tracker-restapi-production-materialized-view-service - Admin panel issues: check
tracker-restapi-production-admin - Notification failures: check
tracker-restapi-production-notification-service
Escalation
Escalate if any of the following are true:
- a service is not
Active - one or more services are not at
1/1 - deployments remain blue for longer than expected
- multiple services fail at the same time
- logs show repeated crashes, auth failures, or database connectivity errors
When escalating, include:
- the cluster name:
tracker-restapi-production-cluster - the affected service name
- the time you observed the issue
- the most recent log error or stack trace